Full Content
Email Marketing Intelligence
What is driving foot traffic to your property? Find what works best for you without spending hours creating a spreadsheet.
Track which email campaigns drive tour bookings, applications, and leases. See ROI per campaign—stop sending emails that don’t convert, double down on what works.
Know the best day and time to send emails for maximum opens and clicks. Tuesday at 10am gets 38% opens, Friday at 4pm gets 12%—send when prospects engage.
See open rates, click rates, and conversion rates for every email. Benchmark against your averages—know which subject lines, content, and CTAs work best.
The Email Marketing Problem Wasting Your Budget
If you’re running email campaigns for leasing, these blind spots are costing you leads and wasting your marketing budget:
⚠️ No ROI tracking: Sending 40 emails per month, but which ones drive tours? Which drive applications? No idea.
⚠️ Timing guesswork: Sending emails at random times—10am one day, 3pm the next—no consistency, no optimization
⚠️ Campaign performance blindness: Email sent to 2,000 prospects, but was 18% open rate good or bad? No baseline to compare.
⚠️ Subject line randomness: Crafting subject lines based on “feels clever” instead of data on what gets opened
⚠️ Audience segmentation failure: Sending same email to students, families, and young professionals—one size fits nobody
⚠️ No engagement insights: Not tracking which content gets clicked, which CTAs work, which links are ignored
⚠️ List fatigue ignorance: Some subscribers engaged 6 months ago, never since—wasting sends on dead leads
⚠️ No A/B testing: Guessing which approach works better instead of testing subject lines, send times, or content variations
Poor email marketing = 20K − 60K annually wasted on ineffective campaigns. Time to get data-driven.
Your New Reality: Complete Email Marketing Intelligence
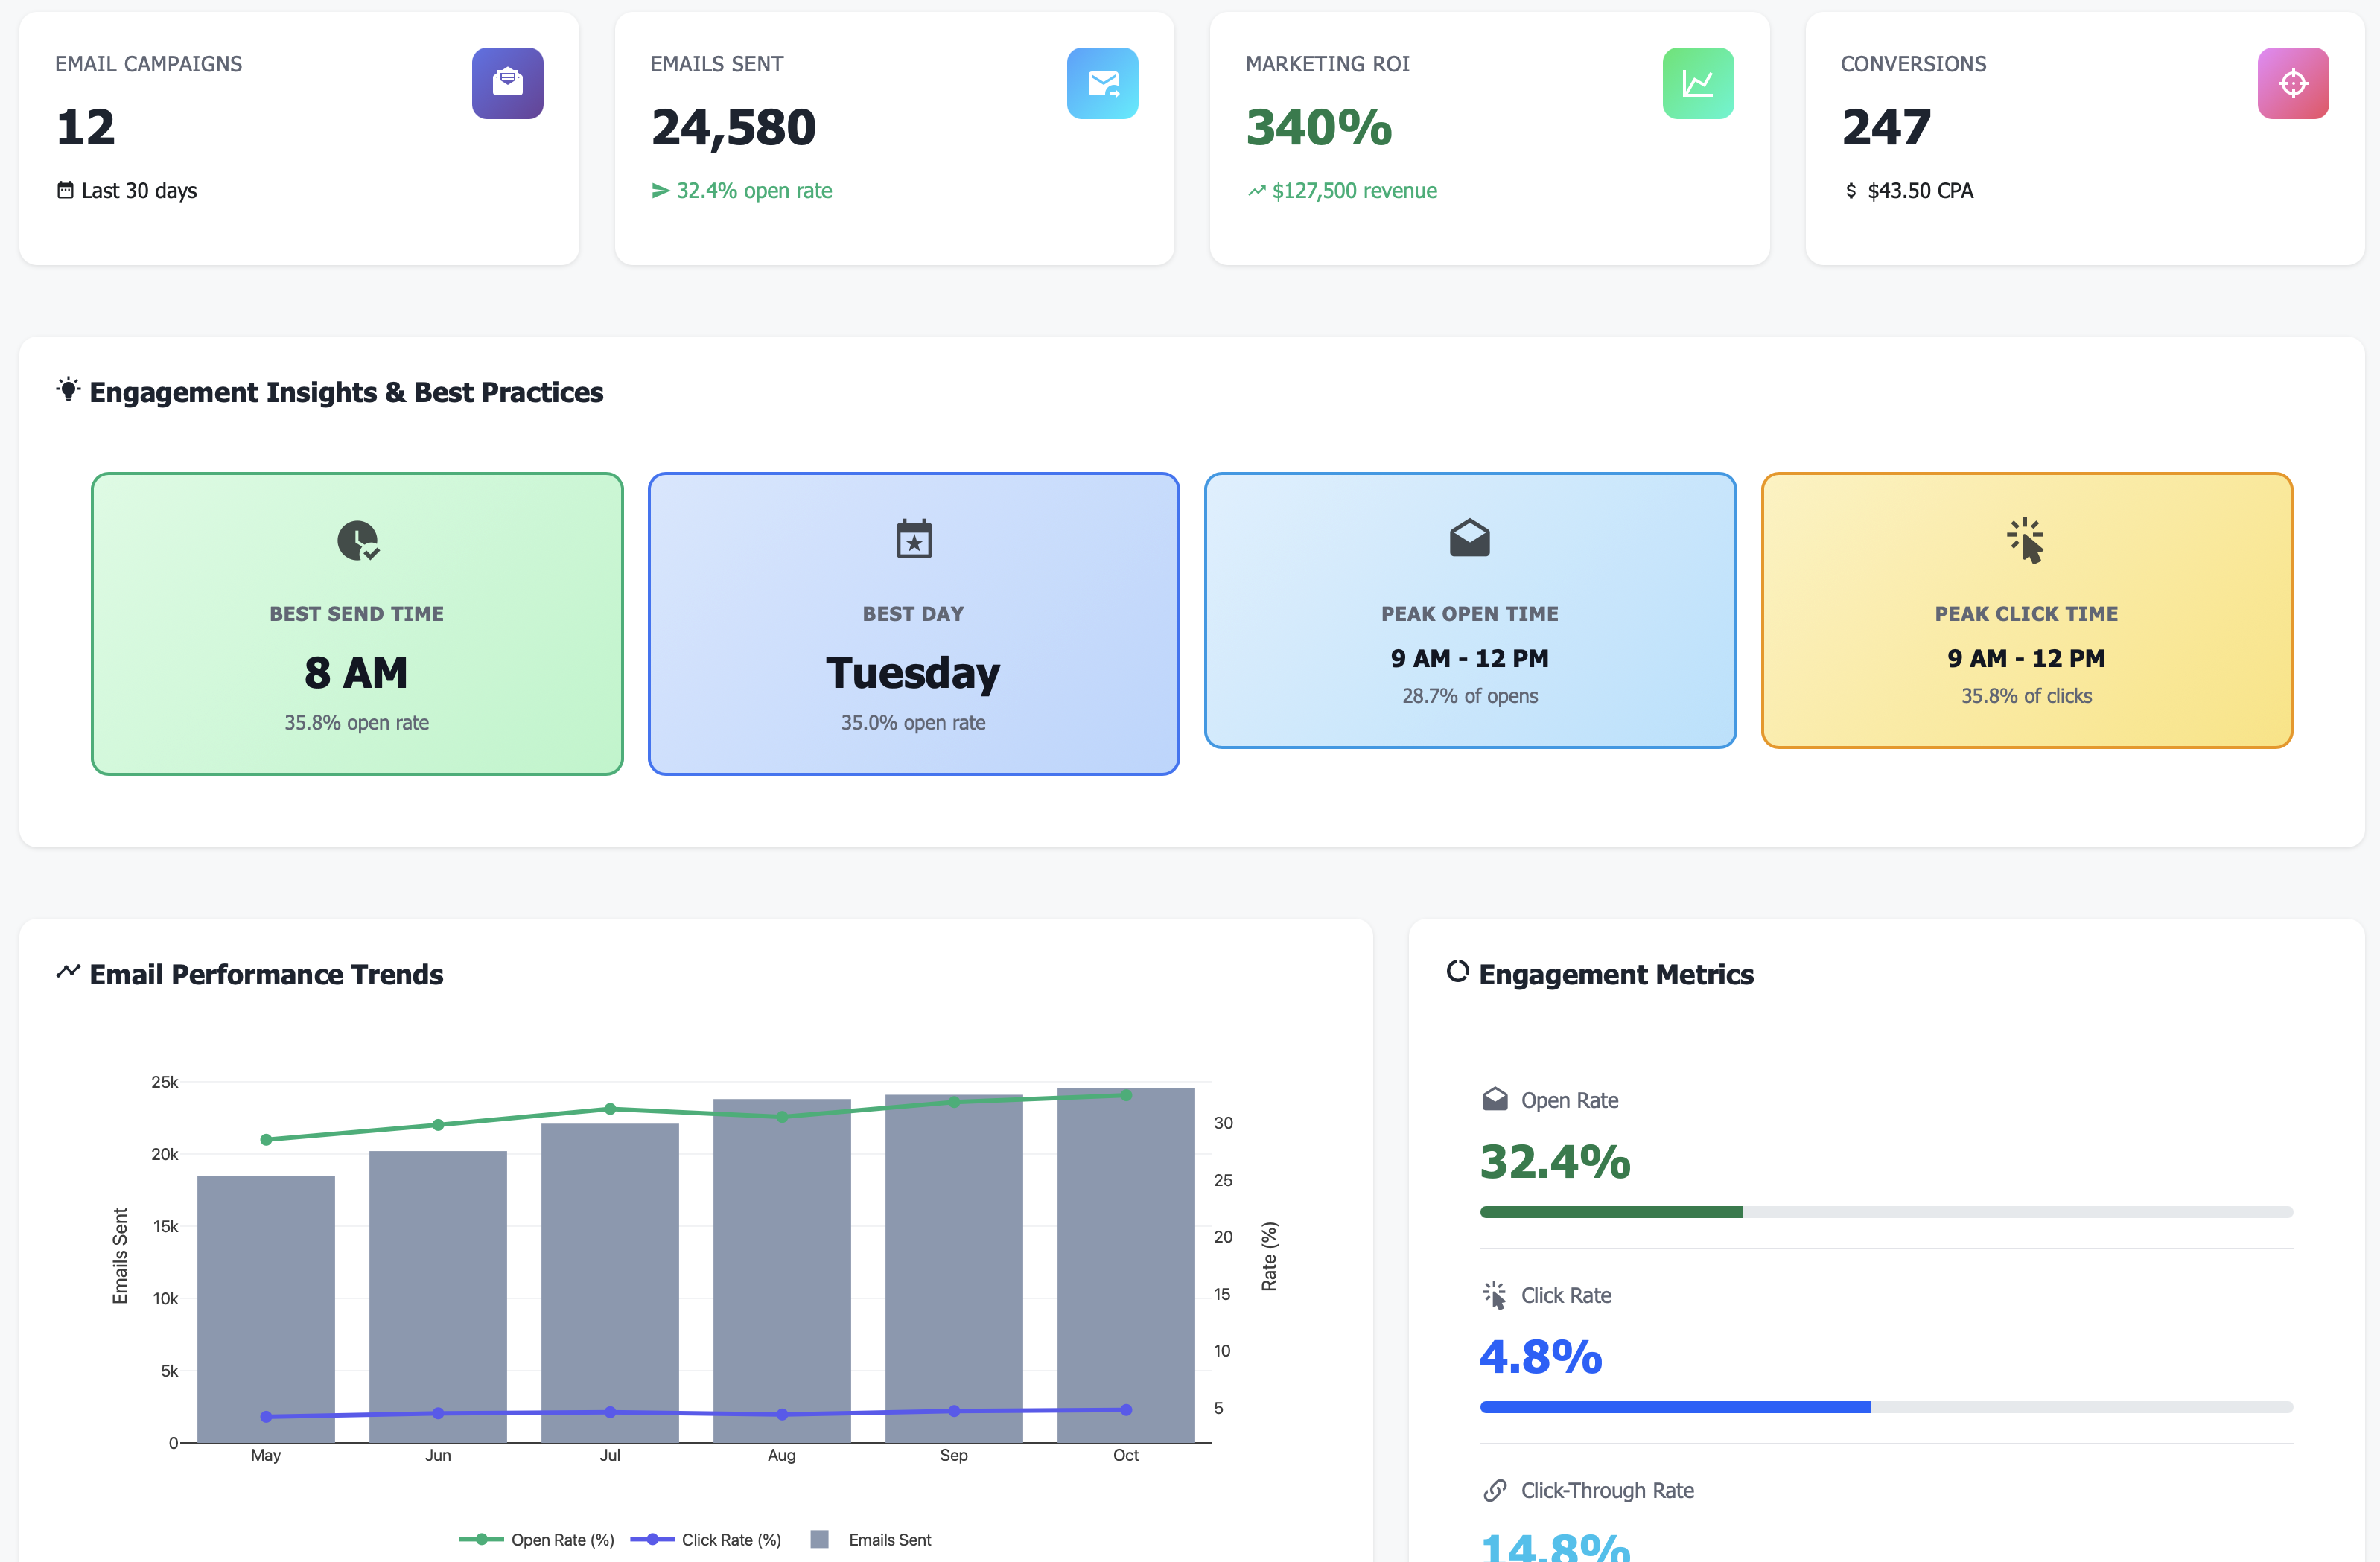
Campaign Performance Tracking
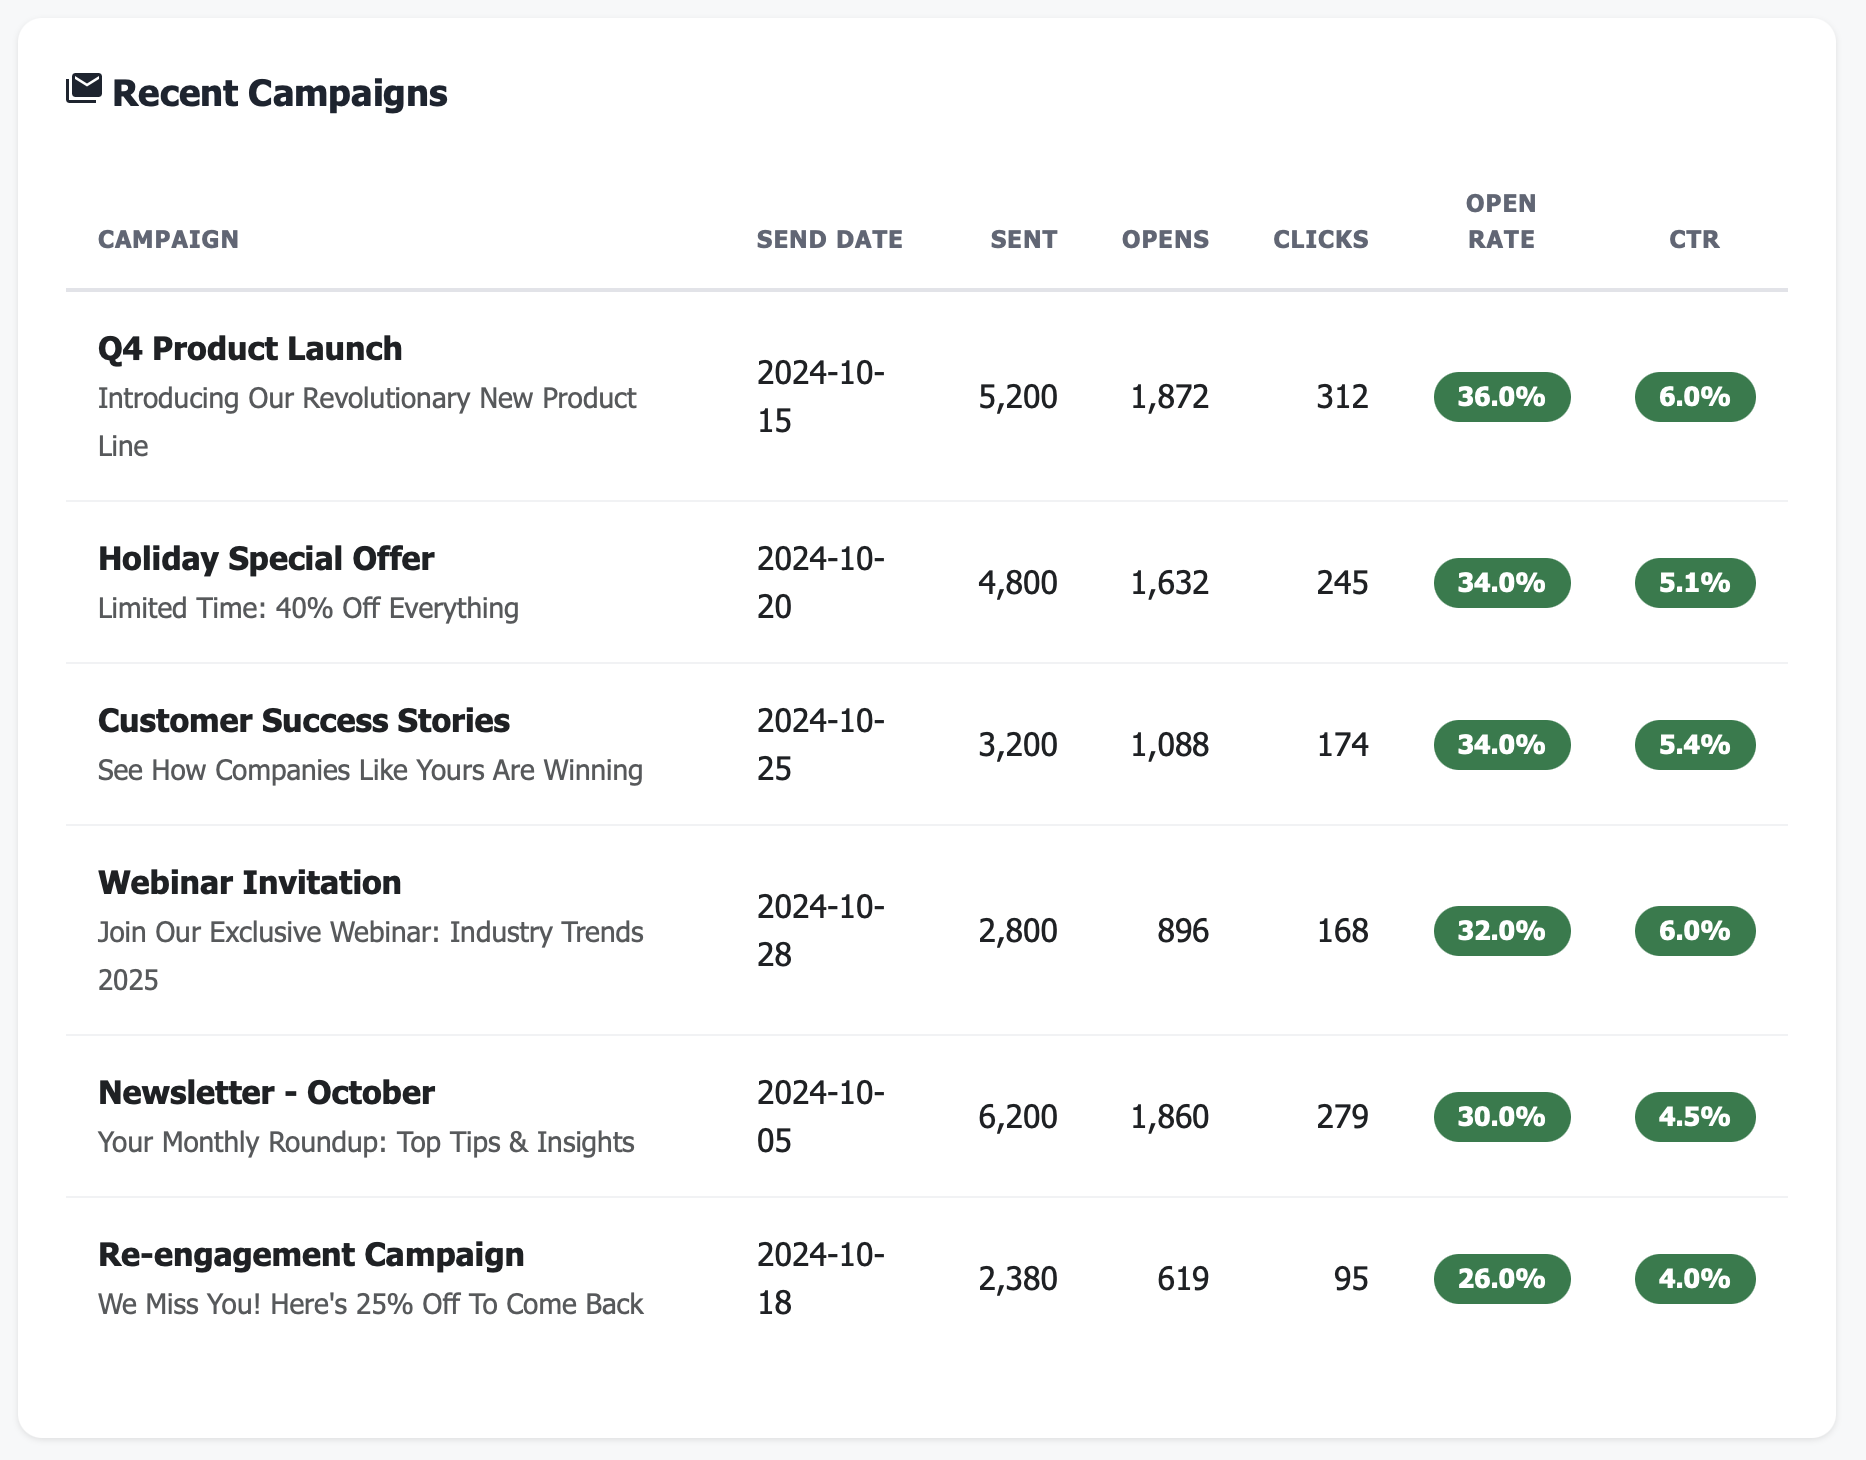
Know what works, what doesn’t:
Spring Special (3/15): 2,400 sent, 34% opens, 5.2% CTR, 12 tours booked (ROI: $4,800)
Pet-Friendly Promo (3/22): 1,800 sent, 28% opens, 3.8% CTR, 6 tours booked (ROI: $2,400)
Weekend Move-In (3/29): 2,100 sent, 15% opens, 1.2% CTR, 2 tours booked (ROI: $800 - underperformed)
Data-driven decisions, not guesswork
Best Time to Send Analysis
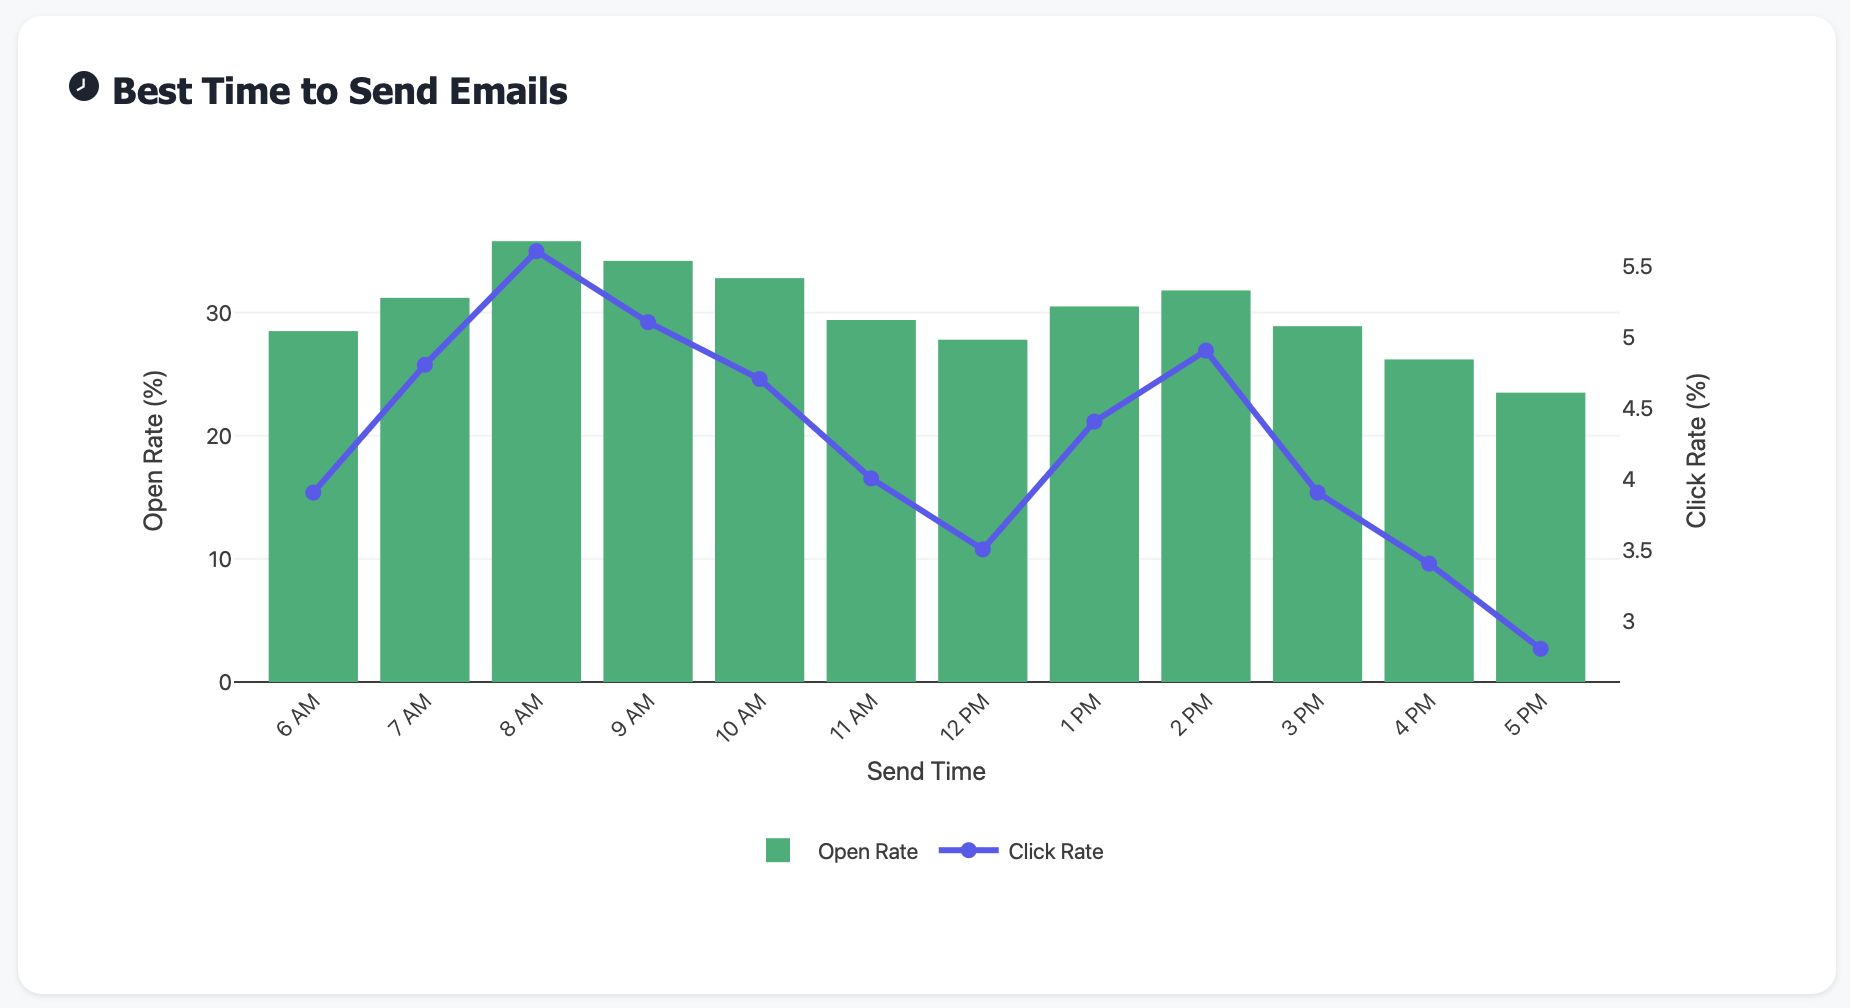
Optimize for maximum engagement:
Tuesday 10-11am: 38% open rate (BEST)
Wednesday 2-3pm: 32% open rate (good)
Thursday 9-10am: 31% open rate (good)
Friday 4-5pm: 12% open rate (avoid)
Sunday: 8% open rate (avoid)
Send when prospects are actually reading
Engagement Insights
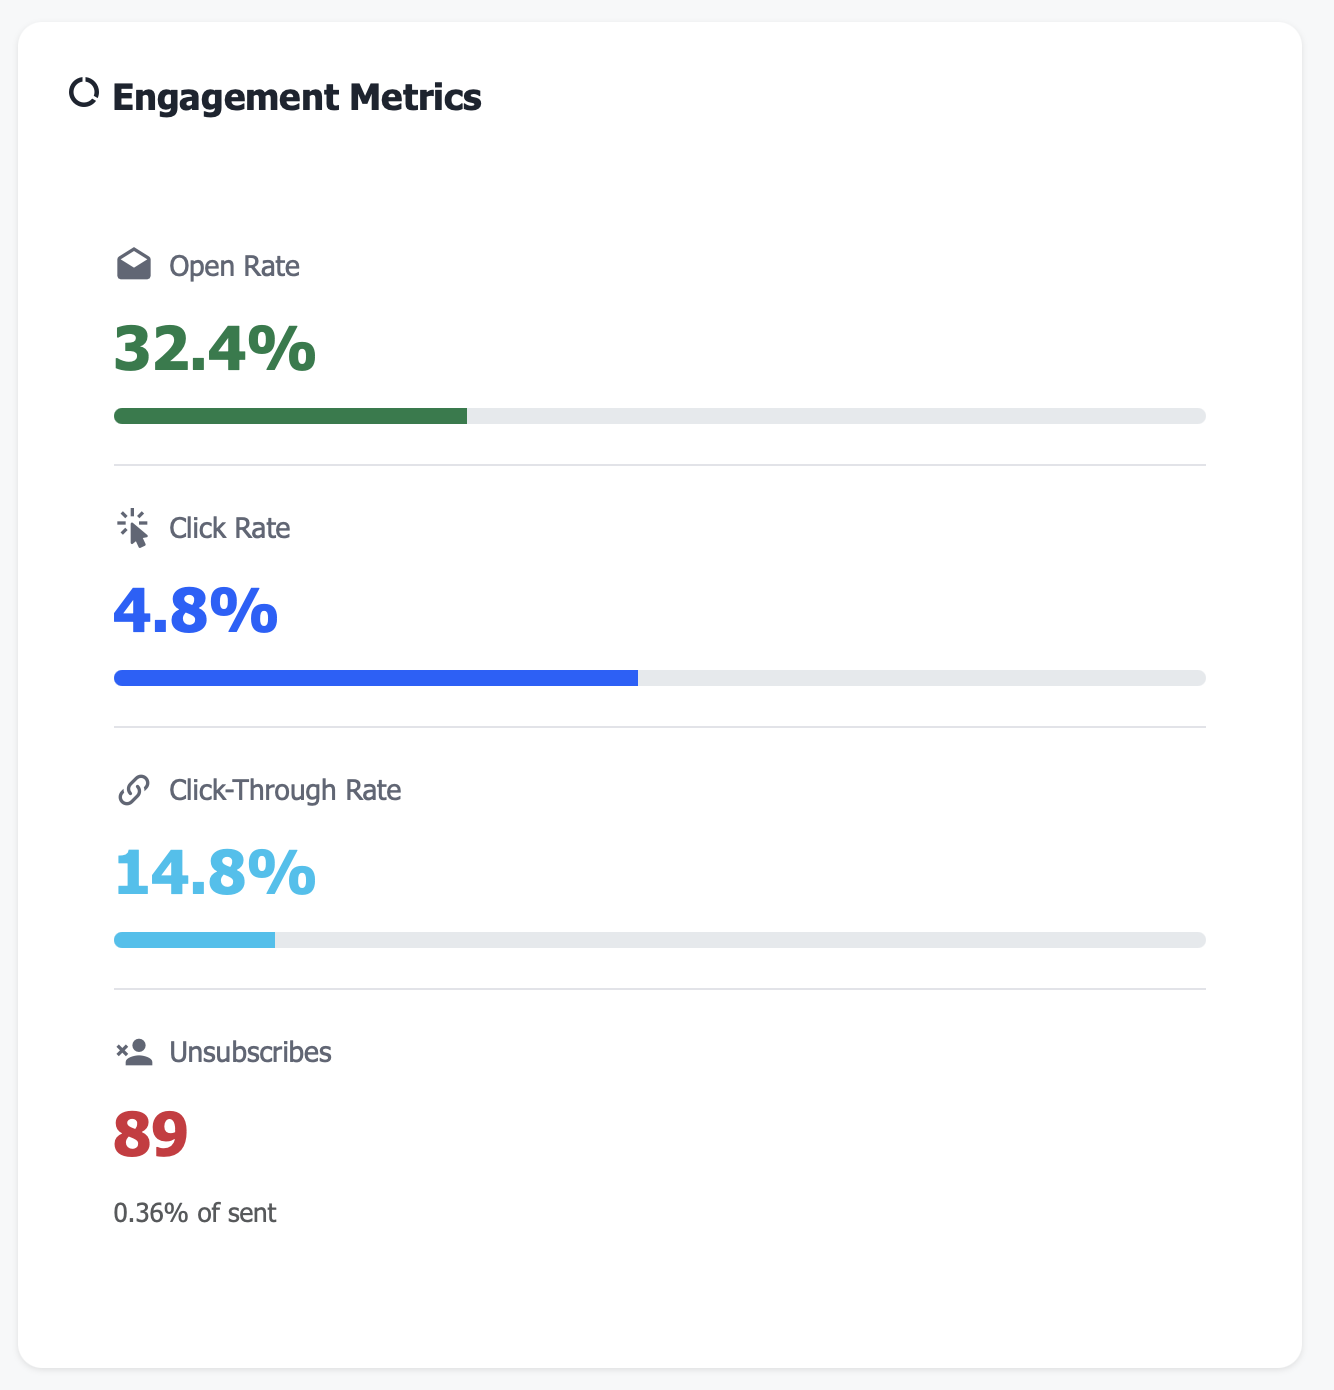
See what drives action:
Top subject line: “Tour This Week, Get $500 Off” (42% opens)
Best CTA: “Schedule Your Tour” (8.2% click rate)
Most engaging content: Virtual tour videos (65% engagement)
Worst performing: Long text emails (18% engagement)
Replicate winners, eliminate losers
Real Results: From Email Spray-and-Pray to Conversion Machine
Metric |
Before Marketing Intelligence |
After 12 Months |
|---|---|---|
Average open rate |
18.5% (inconsistent) |
32.8% (optimized timing) |
Average click-through rate |
2.1% (poor content) |
4.9% (optimized content) |
Tours booked per campaign |
4.2 average (weak) |
9.8 average (strong) |
Email marketing ROI |
1.8x (barely profitable) |
5.4x (highly profitable) |
Cost per tour |
$125 (expensive) |
$48 (efficient) |
List engagement rate |
22% (lots of dead weight) |
41% (cleaned list) |
Campaign send time optimization |
Random |
Data-driven (best times) |
Annual marketing efficiency gain |
— |
$42K saved + better results |
Features That Transform Email Marketing
Perfect For
Marketing Managers
Prove ROI of email campaigns, optimize send times and content, track conversions to tours and leases, and eliminate waste on ineffective campaigns
Leasing Teams
See which campaigns drive the most tours, understand what messaging resonates with prospects, and provide feedback on campaign effectiveness
Regional/Portfolio Managers
Benchmark email performance across properties, replicate successful campaigns portfolio-wide, and ensure marketing budgets drive actual leasing results
Use Case: From 18% to 33% Open Rate ($42K Efficiency Gain)
Real Customer Story
Challenge: A 3-property, 850-unit portfolio sent 40-60 email campaigns per month but had no systematic tracking. Open rates averaged 18.5% (below industry average), no one knew which campaigns drove tours, and email marketing ROI was unclear. Annual email marketing spend: $48K on platform, design, and staff time—but was it worth it?
Dashboard Revealed:
Average open rate: 18.5% (below 25% industry average)
Average CTR: 2.1% (below 3.5% industry average)
Send times: Completely random—8am, noon, 3pm, 5pm—no consistency
Campaign ROI: Not tracked—no connection between emails and tours/applications
Top 5 campaigns: 32-38% open rates (what did they do differently?)
Bottom 5 campaigns: 8-12% open rates (why so bad?)
Send time analysis: Friday afternoon emails 12% opens, Tuesday morning 34% opens
Subject line patterns: Questions performed better than statements
List health: 38% of list hadn’t engaged in 90+ days (dead weight)
Mobile opens: 72% on mobile, but emails not mobile-optimized
Action Taken:
Send time optimization:
Stopped sending Friday afternoons and Sundays
Concentrated sends on Tuesday 10-11am and Wednesday 2-3pm
Result: Average open rate jumped from 18.5% → 28%
Subject line formula: Analyzed top performers, found patterns
Questions outperformed statements (34% vs 22%)
Urgency + specificity worked (“Tour This Week, Save $500” vs. “Check Out Our Specials”)
Emoji tested: slight lift (29% vs 27%)
List cleaning: Removed 38% of subscribers who hadn’t engaged in 90+ days
Improved deliverability (reduced spam folder risk)
Open rate jumped from 28% → 32% (cleaner list = more engaged)
Mobile optimization: Made all templates mobile-responsive
72% opened on mobile, so optimized for mobile-first
CTR improved from 2.1% → 3.8%
Segmentation: Split list into 4 segments
Students: Emphasized price, proximity to campus, short-term leases
Young professionals: Emphasized amenities, location, lifestyle
Families: Emphasized schools, space, safety
Empty nesters: Emphasized low-maintenance, services, quiet
Campaign type optimization:
Virtual tour emails: 42% open, 6.5% CTR (strong!)
Pet-friendly promotions: 38% open, 5.2% CTR (strong!)
Generic “check us out” emails: 14% open, 1.8% CTR (killed these)
A/B testing program:
Tested subject lines (always test 2 versions)
Tested send times (Tuesday 10am vs Wednesday 2pm)
Tested CTA buttons (“Schedule Tour” vs “Book Now” vs “See Availability”)
ROI tracking: Connected email platform to tour scheduling system
Tracked which campaigns drove tours
Calculated revenue per campaign
Killed campaigns with ROI <2x
Results After 12 Months:
Average open rate: 32.8% (up from 18.5%, 77% improvement!)
Average CTR: 4.9% (up from 2.1%, 133% improvement!)
Tours per campaign: 9.8 (up from 4.2, 133% improvement)
Email marketing ROI: 5.4x (up from 1.8x, 200% improvement)
Cost per tour: 48(downfrom125, 62% reduction)
List engagement: 41% active (up from 22%, cleaned list)
Campaign send times: 100% during optimal windows (Tuesday/Wednesday mornings)
Mobile optimization: 100% mobile-responsive (vs 0% before)
Annual marketing efficiency: Same $48K budget driving 2.3x more tours (119 tours/month vs 51 before)
Effective cost reduction: $42K in “saved” waste (more results, same budget)
Tours driven by email: 1,428 annually (vs 612 before, 816 additional tours)
Lease conversion rate: 22% of email-driven tours → 314 leases from email vs 135 before
“We were sending emails because ‘that’s what you do,’ but had no idea if they worked. The data showed us exactly when to send, what to say, and who to target. Same budget, 133% more tours.” — Marketing Manager
Key Email Marketing Metrics You’ll Track
Technical Integration (Works With Your Stack)
Data Requirements & Accuracy
Getting Started
1️⃣ Connect Your Email Platform Integrate your email marketing platform (Mailchimp, SendGrid, etc.) to pull campaign performance data—sends, opens, clicks, bounces.
2️⃣ Import Historical Campaigns Load 6-12 months of past campaign data to establish your baseline open rates, click rates, and performance trends.
3️⃣ Set Up Conversion Tracking Connect your tour booking system or implement UTM tracking to attribute tours and applications to specific email campaigns.
4️⃣ Define Audience Segments If you segment your email list (students, families, etc.), tag these in the system so you can compare performance by segment.
5️⃣ Establish Benchmarks The system calculates your average open rate, CTR, and conversion rate. These become your benchmarks for evaluating future campaigns.
6️⃣ Start Optimizing Week one: Identify best send times. Month one: Test subject line variations. Quarter one: Optimize campaign types and kill underperformers.
Frequently Asked Questions
Q: What’s a good open rate for apartment marketing emails? A: Industry average is 20-25%. Best performers achieve 30-35%+. Below 15% indicates problems with subject lines, send times, or list quality.
Q: How do I improve my open rate? A: Top factors: (1) Send time optimization, (2) Compelling subject lines, (3) List cleaning (remove inactive subscribers), (4) Consistent from name/address, (5) Mobile optimization.
Q: How often should I send marketing emails? A: Depends on your audience. Test frequency—most portfolios find 1-2 per week optimal. More than 3/week often increases unsubscribes. Monitor engagement for signs of list fatigue.
Q: Can I track which emails lead to leases, not just tours? A: Yes, if your tour booking system connects to your property management system. You can track email → tour → application → lease for complete ROI calculation.
Q: What if my campaigns have low open rates? A: Common causes: (1) Bad send times, (2) Weak subject lines, (3) Poor sender reputation, (4) List quality issues. The dashboard identifies the specific problem for your campaigns.
Q: Should I A/B test every campaign? A: Test strategically. Test subject lines on your most important campaigns. Test send times quarterly. Test major content changes. Don’t over-test small campaigns.
Q: What’s the difference between open rate and click-through rate? A: Open rate = % who opened the email (interest). Click-through rate = % who clicked a link (engagement). Both matter, but clicks are stronger indicators of campaign success.
Q: How do I know if my email marketing is worth the investment? A: Track ROI: (Tours × Lease conversion rate × Average value per lease) ÷ Email marketing cost. If ROI >3x, you’re doing well. If <2x, optimize or reconsider budget.
Stop Sending Emails Into the Void
Every month without email marketing intelligence means:
Sending campaigns at wrong times—18% opens when you could get 32%
Using subject lines that don’t work—guessing instead of learning
Emailing dead leads who never engage—wasting budget and hurting deliverability
Not knowing which campaigns drive tours and leases—can’t optimize what you can’t measure
Missing A/B testing opportunities—running same playbook when better approaches exist
Over-sending or under-sending—no data to guide frequency
Email marketing optimization = 30-50% improvement in open rates + 50-100% improvement in CTR = 2-3x more tours per email sent.
The question isn’t whether you need email marketing intelligence.
The question is: How many tours are you missing because your email strategy is based on guesses?